|
|
|
|
|
 |
Welcome to Audio Innovation! A truly one-of-a-kind speaker
resource center. A web site by the fanatics - for the fanatics. Within
these pages you'll find a vast amount of information to quench your
thirst for designing & building loudspeakers. I've gathered as much
useful information as I have been able to find over the years and long
with my own experience and knowledge and compiled it here on this web
site. My personal audio craze began over 30 years ago when I built my first pair of two-way
speakers.
The drive to build nicer and better-sounding speakers has only
escalated since and I have no plans for giving it up any time
soon. I have a passion for music, audio, Home Theater and most
of all - I just love building speakers.
|
|
|
There's nothing like being able to listen to a lifetime of great
music after having spent just a few months in the garage working on
a new sub or a pair of speakers. This
site is dedicated to all those who consider themselves (to steal a
phrase from Parasound) - literally obsessed with sound, to those of
you who stay up late at night envisioning new and innovative
subwoofer and speaker designs - and to those who are just starting
out in the world of DIY loudspeakers. I hope you find all the
answers to the questions you have and that your minds be enlightened to the never-ending possibilities in loudspeaker design. |
|
 |
|
|
|
The Audio Innovation Blog |
|
|
|
October 17, 2022
It's been over two years now since I've
updated this web site, but certainly not as long since I've been playing
around in the world of audio and speakers. At this point I will probably
no longer be updating this web site as I've moved all of my projects
over to my Wordpress Blog. I'll leave this site up as an archive to some
of my older projects but will no longer be updating it with any new
content. To stay up to date with speaker projects I'm working on, please
visit The Blog for Whoever over at
https://www.danmarx.org/blog/.
While not necessarily dedicated to speaker projects only, the majority
of what I write about is audio related for the most part, with the
occasional computer project, home DIY project, or RC car/plane project
thrown in for good measure. So thanks for stopping by, and don't forget
to check out
https://www.danmarx.org/blog/ for all future DIY speaker endevours.
Thanks again! - Dan
 |
|
|
August 30, 2020
Latest project - 15" Ultimax UM15-22
subwoofer! I just finished this new addition to the family room theater
a couple weeks ago. We've got some bumping bass once again! The project
was super fun to work on and only took me about a week to complete. Now
I remember why I enjoy building subs so much, they are way easier than
building full-range speakers. Not having to deal with designing and
testing the crossover and buying a bunch of extra parts. It's just a
driver and a box. I did complicate things a little bit by adding a
miniDSP, but that really just makes things more fun. The sub is powered by a
Crown XLS 1002 amplifier with a sleep relay to enable it to be powered
on and off with the rest of the setup. It's a great-looking sub and adds
plenty of bump to our little theater.
Check out the whole write-up over at www.danmarx.org/blog |
|
|


 |
|
|
August 28, 2019
So it's been two years since my last speaker
project, which in reality seems like too long, but alas, I present you
with my latest and greatest speaker project! The
Dayton HiVi RTS181.3
Two-way Bookshelf Speaker. This isn't actually a new build, but a
makeover of my old Monitor W690X speakers. They consist of a Dayton
Audio RS180-8 7" woofer and HiVi Research RT1.3WE Planar Ribbon tweeter.
I designed a custom external 24 db/octave crossover which features full baffle
step compensation and special notch filters on the woofer and tweeter to
help improve the frequency response and lower the cone break-up modes
of the woofer. It was a fun project and kept me busy for several months.
Plus I really got to dive into crossover design and measurement
techniques. Click the link
here to head on over to my blog to read all about them!
_small.jpg)
_small.jpg)
_small.jpg)
_small.jpg)
_small.jpg)
_small.jpg)
April 15, 2017
The speaker project is complete! Yesterday
I installed the last driver into the all-new DM-4 Reference Speaker system
and set them up in my house and they look awesome! Definitely my greatest
speaker-building masterpiece yet. I haven't got the crossovers or any of
the stereo gear hooked up, so I haven't listened to them yet, but they at
least look the part for now. I'm working on packaging up both the MiniDSPs
into an old VCR enclosure that I gutted. I still need to purchase a bunch
of RCA cables to hook up all 6 channels and I'm looking at picking up a
pre-amp as well. Until then if you want to read about the DM-4 speaker
build from beginning to end, here's the link to each of the blog entries
for a complete (and long) write-up of the entire process.
DM-4
Reference Loudspeakers Part II – Bottom Cabinets Nearing Completion
https://www.danmarx.org/blog/?p=1500
Damping
Methods, First Listen and Measuring the DM-4 Speakers Part III
https://www.danmarx.org/blog/?p=1630
Check it out, there's almost a thousand
pictures of entire build process plus I did my best to do some decent
write-ups describing the build process for each step. It's by no means a
speaker building tutorial, but there's definitely a lot of good (hopefully
good) information amongst those pages. So feel free to check out the links
above and feel free to leave a comment in the comments section of my blog
if you like the project!

September 27, 2016
The DM-4 Active Reference Loudspeaker
project is alive and in full force! The details can be found over on my
Blog for Whoever located at www.danmarx.org/blog.
Stop by and check it out to see how it's coming along. Lots of pictures
and long-winded write-ups. Plus cool videos with music! Click the link
above to check it out.
Maytember 16th 2014
So the last time I updated this site was 6 years ago.
Wow. I am the worst. Ever. Life has been busy for me these last 6 years so
I honestly can't blame myself entirely for not posting as much as I
should. But I've vowed once again to try and be better, to update this
site, to correct stuff that's wrong and to try and make this site more
useful. The last project I worked on was pretty awesome actually, I got to
work with my little brother on his Home Theater and we built enclosures
for (4) 15" TC Sounds LMS-R drivers and powered them with (4) Crown
XLS-2500 series amps. You
can check out the entire project over at my blog here. It was overall
an amazing time, hanging with my bro, building speakers, just like we did
when we were teenagers. So check it out, it's a quick read with lots of
pics. I can highly recommend that sub/amp combo. It's a match made in
heaven.
 |
Other things that have been going on, I've nearly
finished my AirPlay-equippped whole-house audio setup. That's right,
whole-house audio run entirely via Apple Airport Expresses I've bought off
Craigslist and eBay. I've got four of them right now, two of them run to a
pair of Lepai
LP-2020A+ amps and then to a set of Parts Express in-ceiling speakers
- one pair in our master bathroom and the other pair in the kids playroom.
The other two are in the entertainment center and go to the main home
theater speakers and also out to the patio speakers. I've got 2 more pairs
of in-ceiling speakers that I'm not sure what to do with yet but will plan
on adding those with another pair of Airports and Lepai amps. It's
seriously such an awesome setup, the ultimate poor-man's whole house
audio. |
The Airport Expresses are 1st gen wirelessG only (but hardwired to
my LAN) and run for about $20. The Lepai amps are $20 all day long from
Amazon. And for speakers, the sky is the limit, but I usually opt for
something cheap at around $50. I mean they are speakers mounted into
drywall, how good can they really sound? So there you have it, less than
$100 per zone for a fully-functional whole-house audio setup that already
integrates seemlessy with iTunes, iPhone, iPad and iPod Touch devices.
I'll post pictures of the setup once I get around to it, but it doesn't
look nearly as cool as how well it actually works.
The other project I have in the works is a new
full-range floorstanding set of high-end, hi-fi speakers utilizing the
brand new Paper Cone series of Dayton Audio Reference woofers from Parts
Express. You can check out the details of the
beginnings of this project here. Like it or hate it, this is going to
keep me occupied for the next several months (or years). But I'm not it a
huge rush to get them done, I'm hoping it can be something I can work on
at nights in the garage after the kids go to bed and just enjoy building
and working on. I know me though, I get so eager to finish stuff that I
rush through it and make mistakes and get mad and throw stuff and get hurt
and I'd rather this just be a stress-free fun project to work on with no
time contrainsts to speak of. So check it out! And that's it for me.
|
|
May 24th 2008 - My Home Theater is Finally Complete
After 3-1/2 years in the new house, I finally finished
all the projects which would make up my home theater. Okay, well
it's more like a living room theater, but just the same. The only
speaker I didn't rebuild is the center channel, for now. But every
other speaker started from scratch and is brand new. Starting with
the new two-way bookshelf speakers modeled after Parts Express's Encore
speakers which utilize an RS-150 6" woofer and RS28A tweeter. These
speakers sound so great and take up very little room. They offer big
sound in a small package and I am very delighted with their performance.
You can read more about them here.
I finally got around to installed a new pair of Dayton
ES series 6-1/2" surround sound speakers. I haven't had surround
sound for so long, I forgot what it sounded like. The first few
movies I caught myself peaking out the back window wondering why it
suddenly started raining. So for the most part, they add enough
realism to movies to really bring in the action. You can read about the whole
installation of these speakers on my blog.
I also finished building a new subwoofer using an
Audiopulse EPIC 12" driver. The sub sits in a modest 95L box tuned
to 22Hz but man oh man does it sound awesome. It was designed to be
integrated into the new entertainment center that I recently built.
It's hidden away and offers some great LFE for just about every movie.
It can produce some great bass into the high teens and sounds amazing.
I couldn't be more happy with it Click
here to read all about it.
And last but not least is the entire entertainment
center that houses all these new speakers. I thought building
speakers was hard enough, building this beast really took its toll.
But it was definitely worth it. You can read more about the
entertainment center build here,
And that's about it. I'd say the first half of
2008 has been a productive one. Please click on the links to
some of the projects I've been working on and as always, feel free to
email me with any comments or questions! Thanks. -DM
|
|
|
March 2nd 2008 - Sealed TC Sounds TC-3000 Subwoofer
with PE's HPSA1000 Plate Amp Here's my first sub
project for '08! It's TC-3000 sub mounted in a 100L sealed
enclosure with a Parts Express HPSA1000 amplifier. Click on the
picture below for more details. This sub rocks the house and looks
good doing it.

|
|
|
July 19th, 2007 - Got Some New Measurement Equipment -
Behringer ECM8000 and Xenyx Mixer In my quest
to understand designing, building and testing loudspeakers better, I
bought a Behringer ECM8000 Omnidirectional Measurement Microphone and a
Xenyx 802 Mixer. They arrived today from
Parts Express and I've been
having some fun measuring my two-way monitor speakers in my living room.
If it weren't for the huge thunderstorm that passed over tonight, I would
have done these measurements outside. I've actually had more fun
trying to mic my piano so I could get some decent recordings of me
playing. The ECM8000 definitely sounds better than my old PC mic,
and a lot better than my old EV voice mic. If my piano only sounded
better and didn't squeak so much. Soon to come will be outside
measurements on several more of my other speakers I've built in the past,
as well as some FR plots of the Dayton RS1505 6" woofer and RS28A tweeter
which will be going into a new 3-way speaker design that's in the works.
Here's some pics!


The first plot of my Monitor
W625X Speakers measured at 10" from baffle and 34" from floor w/1/3
smoothing on. |
|
|
July 8th, 2007 - The Completion of the Dayton-Morel MTM
Home Theater Speaker System We just finished a
set of MTM speakers for my friend's basement home theater. Click on
the picture below for more details.
- 7" Dayton Aluminum Woofers
- 1" Morel MDT-20 Tweeters
- MTM configuration
- Left/Right Speakers in a 1.52 cu.ft. box tuned to 34
Hz with 3" x 7-3/4" port
- Center Channel Speaker sealed box 0.88 cu.ft.
- 18dB/octave crossover at about 1.9kHz
- Cabinets mounted into wall
 |
|
|
March 2, 2007 - 2nd Time FR Plot Looks Better
I ran another sweep of my Reference
10" sub and this time I got much more reasonable results. I'm
not sure what I did differently, but the measured response follows the
modeled response much more closely now, and is much more believable.
All in all it still looks very good though. There isn't a nice flat
region anywhere in the response, but it's only down 3dB out at 30Hz and
with the help of the low-pass filter in the amp, I can keep the upper
response from getting out of control. Without the low-pass filter
the response above 70Hz would most likely continue to rise therefore
creating a higher apparent f3, or 3dB down relative to some higher point
on the graph. You can see the 12dB high-pass filter kicking in from
the amp as well which accounts for the sharper roll-off below 20Hz.
I also did an in-room response first with the meter in
front of the TV and then again at the listening position across the room.
Even with the room modes, the sub still is pretty flat and plays plenty
low, considering its size. With some EQ'ing we could tailor out the
bumps, but since I don't have any EQ to play around with, I get to just
leave it at that. In the end it's how the sub sounds, and this sub
sounds great. I haven't listened to any music with it, but I imagine
it would be great for music too. But for movies it rumbles and
rattles the house and doesn't put a hole in your wallet. The last
graph compares the modeled response versus the measured response.
The 1dB bass boost shows up as well as the high-pass filter used to
created that boost. From here if I wanted I could start adding boost
to achieve a flatter response, but as you can see from the in-room
response, there's isn't much need for any additional bass boost. So
I'm going to leave it for now and call it done.

  |
|
|
February 12, 2007 - New Speaker Stands, Frequency
Response Plots of the 10" RSS Sub and TC Sounds dB-500
Out of ease and simplicity, I've been updating my
blog with audio/video
related stuff instead of putting it here. Shame on me, I know.
But it takes so much less time to do the same thing in Wordpress than it
does
in Frontpage, and it actually looks better. But just to keep this
page from getting too old, I have been up to quite of bit of audio stuff
these last few weeks. First and foremost I built a totally sweet
pair of speaker stands for my
Monitor W625X speakers. I took some scrap MDF and a 10 foot 2x6,
made a few cuts, painted it all up, and voila, a perfectly good pair of
speaker stands for almost no money. And so much easier to build than
an actual pair of speakers. Check out all the details
here.
Second, I bought a
TC Sounds DB-500 12"
subwoofer. They were doing a blowout sale for only $75 and I
couldn't resist. Although not their most impressive driver, it has a
stamped steal basket, and an odd-looking one at that, but the rest of the
driver is top-notch, all TC- Sounds, hand-built, and ready to rock.
This sub models some amazing bass in a 3.7 cu.ft. box tuned to 21Hz.
I'm going to drop a 500W Bash amp on the back of it and have some fun.
Stay tuned for that project in the following months.
Third, I found my Radio Shack SPL meter so I finally got
a chance to do some in-room
far-field and near-field response plots of the 22L 10" RSS sealed sub
I built for my dad a couple months ago. This sub looks completely
barebone with it's raw MDF finish, but it sounds quite impressive, touting
a nearly flat in-room response down to 26Hz. The near-field response
looked almost identical to the predicted response, but the gain from my
living proved to be more than a bargain boosting the low end by several
dB. It certainly sounds pretty decent. Of course a better sub
whose natural response is flat to 20Hz would sound even better, I tend
to forget to consider room gain when building subs, but it makes a big
difference. |
|
|
|
January 13, 2007 - The DIY Bug has Kicked In Again - New
Reference MTM Planned Okay, the DIY speaker
building bug has kicked in again and I find myself designing another set
of speakers for no other reason than, well, just because it's fun. I
bought a pair of 6" Reference Series speakers from Parts Express almost 9
months ago along with a pair of the Reference 1" Dome Tweeters with the
intent of refinishing an old pair of speakers. Due to lack of
excitement in such a project, the speakers still sit in their boxes.
What fun is finishing an old pair of tiny bookshelf speakers, when I can
start from scratch and build something new, something I'll really enjoy
design, building and listening to.
So this is the plan, I'm going to pick up another pair
of 6" Dayton reference speakers and do an MTM floorstanding speaker,
similar to my Swans M3 with the 3/4" rounds down the front, with a thin
face, small footprint, and nice and tall. I'd like to do a nice dark
wood finish on the entire cabinet (no black paint like I've been doing
recently). I'm thinking about throwing the port in the back and
getting a pair of really nice brushed nickel bi-amp binding post style
terminals. The drivers will be flush-mounted with some overhang of
the drivers on the tweeter. As the plan unfolds, I'll go into more
detail, but for now it looks like I'll be looking at a box that's about
36x8x10 (HWD) for about 1.1 cu.ft of volume and tuning the box to 48 Hz
with a 3" port that is 6" long. This results in an f3 of 47Hz, but
with the dual 6" drivers we'll have an super-efficient speaker system that
will be able to play loud and distortion free, thanks to all the great
design features of Dayton's reference series speakers.
 |
|
|
December 29, 2006 - Dayton RSS 10" High-Fidelity Sealed
22L Subwoofer I finally got cracking on this
subwoofer project that began almost 10 months ago, and wouldn't you know
that I almost finished it today. With the exception of the finish, I
started out with a scrap piece of 3/4" MDF and tonight I was listening to
it. The basics of the sub are:
Dayton RSS265HF-4 10" High Fidelity Sub powered by a 300W Bash plate
amp and mounted in a tiny 22L box built from 3/4" MDF and stuffed with
R-19 insulation and polyfill. This sub is about as simple as they
come. The plan (maybe) is to incorporate some active EQ via the
tweakable resistors on the Bash amp. For now the amp is in the stock
configuration, which I think is no boost, however we can dial in up to as
much as 5dB anywhere from 20-40Hz or so. Depending on how it sounds
right now, we may not use the boost. Even though it can improve the
low-end frequency response of the sub, or at least make it appear as
though the sub has more low end performance, it does this at the cost of
lots more excursion and lots more power from the amp, both of which may
have a tendency to run out of during heavy action while watching movies.
The result is clipping amps and popping subs, both of which we don't want.
Without any bass boost the sub models well in Unibox and
shows it well within the limits of the 14mm excursion all the way down to
10Hz at 300W input power (chalk one up for sealed boxes).
Unfortunately the F3 of the box is only 42Hz, not much sub in the
subwoofer there, but even at 30Hz we're still able to get over 101dB out
of this little puppy, which is pretty impressive considering the size.
The Qtc of the box is designed to be an eve 0.7 which is typically
considered optimum. Some people choose to overdamp and shoot for Qtc
< 0.7 (bigger box) or underdamp and shoot for Qtc > 0.7 (smaller box, but
most people only do this for car subs where space is an issue, and even
then really high Qtc numbers are still undesirable). Any size box
other than one with a Qtc of 0.7 will suffer a higher f3, therefore is
makes sense to go with 0.7 if the size of the box works out for your
application, and in our case it was a good fit. A ported box was a
bit on the large side for our room, requiring almost three times the
volume, but the payoff would have been an impressive 108dB at 26Hz and an
f3 of 22Hz (even lower if tuned lower). Basically the RS line of
subs from Parts Express can do some damage, even this little 10" in the
right size ported box. But I'm willing to bet that they can do some
damage in a small sealed box as well, which is what we're about to find
out.
For now it's 11 o'clock at night and I haven't got a
chance to really listen to it at all, other than power it up and watch the
intro to Toy Story II, while trying not to wake up the sleeping kids.
Tomorrow will be the official break-in day. Until then, here's the pics,
from beginning to bumping. Dayton RSS10-22 Sealed Subwofer with 300W Bash Amp |
|
|
 |
|
|
|
|
April 1st, 2006 - Speakers Have Arrived!
Speakers arrived yesterday and wow, they look unbelievable!
The RS lines are definitely some of the best speakers I've seen or used in
a long while. The cast aluminum frames are so beefy-looking and feel
super solid. The black anodized aluminum cones on the 6" and 10"
drivers look and feel amazingly tight and feel light at the same time.
I can't believe how heavy the 10" RSS sub is! I know they tell you
it weighs 18 lbs, but you don't realize how heavy 18 lbs. is till your
lugging what looks to be a relatively small sub (at only 10") out of its
box and it becomes no easy feat to accomplish. Wow is it one
sweet-looking sub. It's got all the features you want in a subwoofer
from the sewn-in speaker leads to the phat rubber surround. It looks
like it's going to be a real beast. After running some more box sims
I just love how low this sub can go in small sealed boxes and even ported
boxes that are only 1.6 cu.ft. There's a lot of options for boxes on
this one, and they all look promising. Anyway, here's some pics I
took this morning, they don't do these speakers justice, they just look
awesome. |
|
|
|
|
|
|
|
March 28th 2006 - New Projects in the Making: RS150-28A
Bookshelf Speakers and 10" RS High-Fidelity Sub
I've got an old pair of bookshelf speakers I built a few
years back using an MCM 5.25" aluminum cone woofer (cost $11) and an old
aluminum-dome tweeter (cost $8) which like a magnet has drawn the
attention of probing fingers to the point of permanent damage. Not
that I cared, the speakers were garbage from day one, but the enclosure
was nice, covered in 1/8" mahogany and stained to match some piece of
furniture I once owned. So the Extreme Makeover - Speaker Edition
has begun. I'll be taking this old tattered $38 pair of speakers and
turning them into a pair of Reference Series bookshelf speakers using
Dayton Loudspaker's
RS150S-8 6" woofer and the
RS-28A 1-1/8" aluminum dome tweeter.
I've read nothing but good things about both RS lines of
speakers from PE. While I browsed through their catalog looking for
some new speakers to put into my current bookshelf-sized cabinets, I kept
coming back to the RS line for their great specs, affordable price and
great looks. Not to mention downloadable response plots, a must for
anyone wanted to get a semi-decent crossover design. They
should arrive here this Friday, so I'll take some good close-up pics of
them and show them off. If they sound half as good as they look, I
should be in good shape.
But that's only the beginning of my spring
project, I also picked up an
RSS265HF-4 10" High Fidelity Subwoofer and a 300S Bash plate amplifier
and will be building a small sealed sub for my dad's home theater.
Details are still TBD, but I should have the sub long enough at my house
to be able to run them with the new bookshelf speakers and see how this
setup would work as a sub-satellite system. I'll probably be using
the RS150-28A's as surround sound speakers in my home theater, but I'll
design them so that they would work as just a great pair of main speakers
as well, and with the sub to go along with them, it could pose an amazing
listening experience from a fairly small package and for not a whole lot
of money. I'll start a new page dedicated to the goings-on of both
projects and keep just the short details here in my blog. Please
feel free to email me if you've got suggestions for the either the
RSS2265HF-4 10" sub or the RS150S 6" woofer or RS28A tweeter. The
plan is to be done within the next two months, so the designing phase will
be quick, and the fun phase of building will soon begin. Except in
the case of the Bookshelf Makeover, that box is almost already done!
It's going to get a new front baffle and a new paint job, but will
otherwise be the same box with a new set of drivers and crossovers.
Should be fun! |
|
|
 |
 |
 |
 |
| The Current
Speakers |
Nice
Mashed-in Domes |
RS-28A
Tweeter
(I like the grill!) |
RS150S 6"
Woofer |
|
|
|
March 18th 2006 - 10" Titanic vs. 10" RSS Subwoofer
So my dad says he wants a sub for his 5.1 theater system
(which is currently only a 5.0 system at the moment) and wants me to build
him something to suit his room. He doesn't want anything
outrageous, something small that adds a good amount of bump and rumble for
movies but is no more than about $200. Since I'm looking at about the
same thing for my home theater room, I decided this would be a good opportunity to put
two different subs to the test. The contenders are going to be
Dayton Loudspeaker's 10" Titanic III vs. the Reference Series High-Fidelity 10"
sub. Both subs will be powered by a plate amp which is still
TBD, but since we're trying to get the most watts per dollar, the BASH
amps may be considered.
A quick look at the specs shows the Titanic to have a
much stiffer suspension and higher Fs (at 28Hz) than the RS sub which
touts a resounding 22Hz resonance. Those numbers alone
indicate that a small sealed box should yield better f3 numbers for the RSS sub than the Titanic sub. Which
is exactly how they model. Given the same size box and the same
power, the RSS will have more deep bass, however the mechanical limit is
soon reached on the RSS sub when pushed beyond about 250 watts, whereas
the Titanic can still take quite a bit more. Based
on this analysis, if you drop a Titanic and an RSS HF into the same size
0.68 cu.ft. box and drop the same amp into each, say a 240W plate, the RS
sub will play louder and deeper than the Titanic. But if you've got
more power to spare from a 300 watt or 500 watt plate amp, then the
Titanic will beat out the RS by 3dB alone just in the fact that it can
take twice as much power. More on this later... |
|
|
|
|
|
|
March 5th 2006 - They're
Done! After almost 6 years since I started
these speakers, they are finally done! Talk about never finding the
time to build speakers, I never found the time with these until just this
year. I'm very happy with the way they turned out, even though the
finish is far from perfect, they look great to me. One of these days
I'm going to learn how to stain and how to apply varnish and how to wait
for it to dry, but until then I'll always put the emphasis on how well
they sound not so much how well they look. I haven't
listened to them yet today, I auditioned them a few weeks ago and tested
out the crossovers, so hopefully tomorrow I'll get to run through some
CD's and really see how they sound. Check out the latest pictures
below. I plan on picking up a pair of high-mass metal speaker stands
from Parts Express within the next few weeks so these babies will have
some place to go. Wow, I can't believe they are finally complete!
I hope it never takes me this long to finish a project again. And
speaking of projects, I need to start working on my new surround sound
speakers for the family room. I would use these, but I'm afraid they
are far too nice and their sonic purity would be lost on simple surround
sound effects, or something like that. Honestly though, I just need
a small pair of bookshelf speakers for my surrounds, and I think I have
just the idea. Stay tuned, more info will follow. |
|
|
|
|
|
|
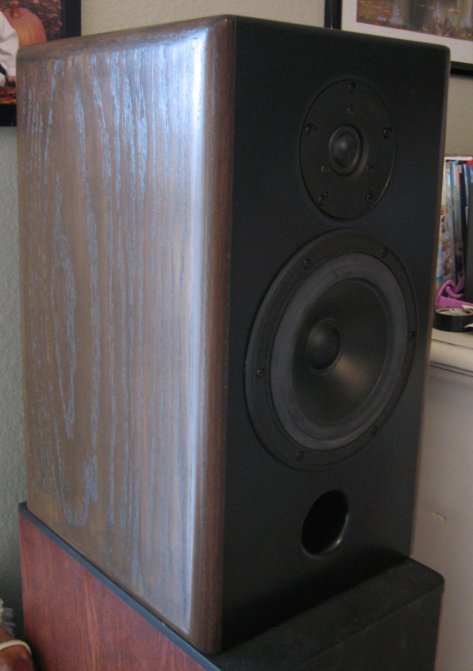
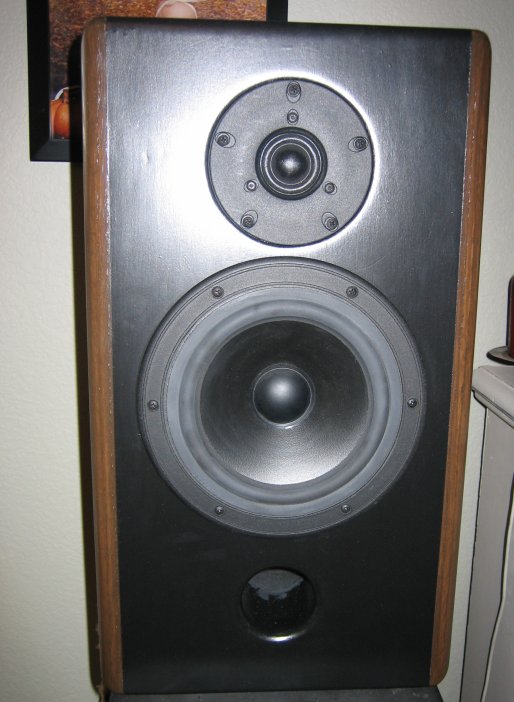
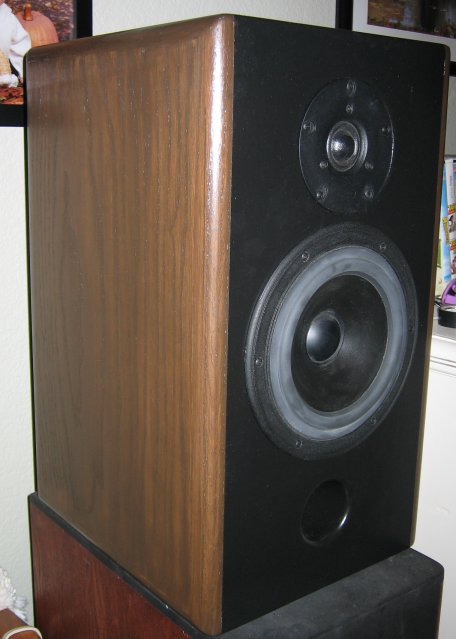
March 5th 2006 - Nearing Completion of Hi-Vi/Vifa
Two-Ways I'm down to the last couple coats of
polyurethane and my new two-speakers will be complete! I stained the
speakers using Minwax American Walnut, which is a water-based stain, and
it turned out exactly the darkness that I was shooting for after three
coats. This is the first time I tried using a water-based stain, but
they didn't have a color that was dark enough in the regular stain so I
figured I'd try it out. I prepared the wood with Minwax Pre-Stain
Conditioner to prevent uneven spots in the stain. I think it worked
out well. I've been bit before by not treating the wood and had the
stain just get soaked up in some spots and not in others, it drives me
crazy. Hopefully I'll be able to get the drivers in later today and
listen to them again. I may end up using these for either the main
speakers with my new 50" Sony LCD in the home theater or as the surrounds.
I may also make a dedicated 2-channel listening room in the living room.
The stain matches all the dark wood theme in that room (side table, piano,
bookcase, so they will blend in nicely sitting on either side of our
upright piano. I'd just have no way of playing them in there, they'd
simply be furniture until I got an amp or something, or wired the stereo
in the family room over to them. There's lots of options, so I may
see where they will get used the best, and where they will look the best.
Until then, here's the latest pics. |
|
Monitor W625X |
|
|
|
|
February 20th 2006 - Painting My Speakers I put on
the first two coats of flat black enamel today. Actually I put on
the first coat last night and did the second coat today. I sanded
with 400 grit sandpaper between coats and will probably do two more coats
before I'm done. I need to buy a better paint brush though before I
do any more coats at all, the brush I have is getting thrashed, and it's
leaving too many brush strokes. Not that a few brush strokes are
bad, since I'm not trying to do the super-deep piano black look, I've
tried that before and it's just beyond my skill level as far as finishing
wood goes. But I do want the black to look smooth and even.
After two more coats, making 4 total, it should look good enough and be
ready for the final topcoat of clear polyurethane. I think
I'll wait till after I've stained the sides though and do the whole box at
once thus integrating where the black meets the stain under one seamless
finish. |
|
|
|
Monitor W625X |
 |
 |
 |
 |
 |
| Sanded 1st Coat |
Sanded 1st Coat |
Second Coat |
Second Coat |
Second Coat |
|
|
|
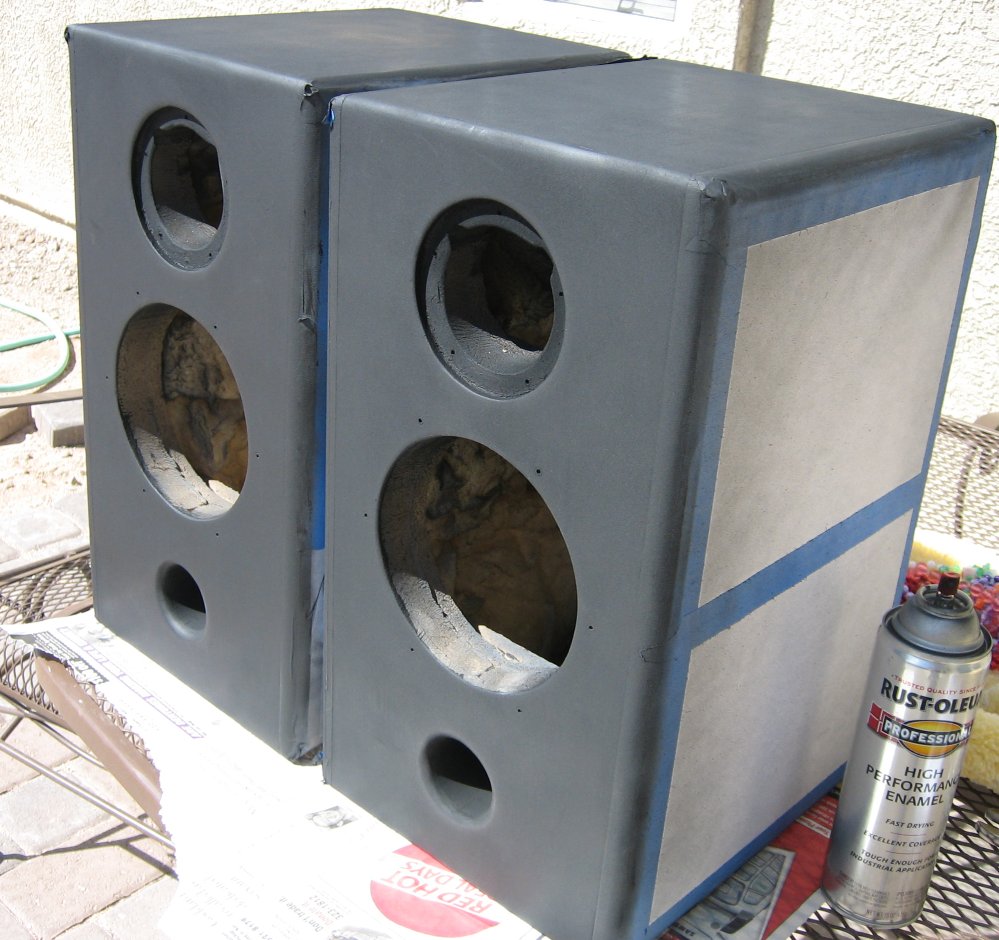
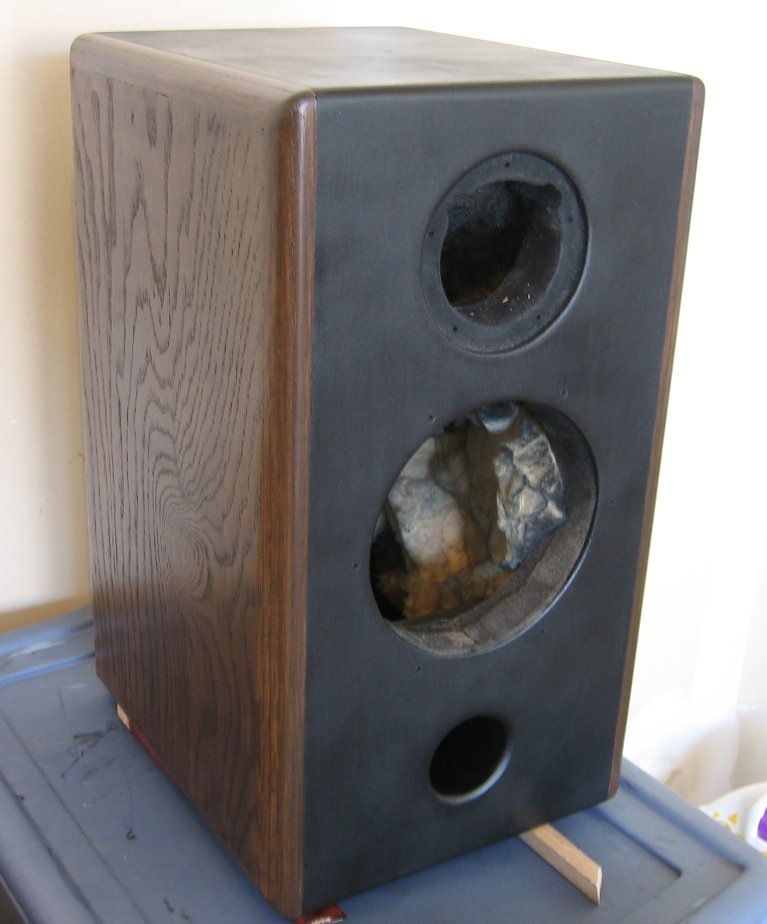
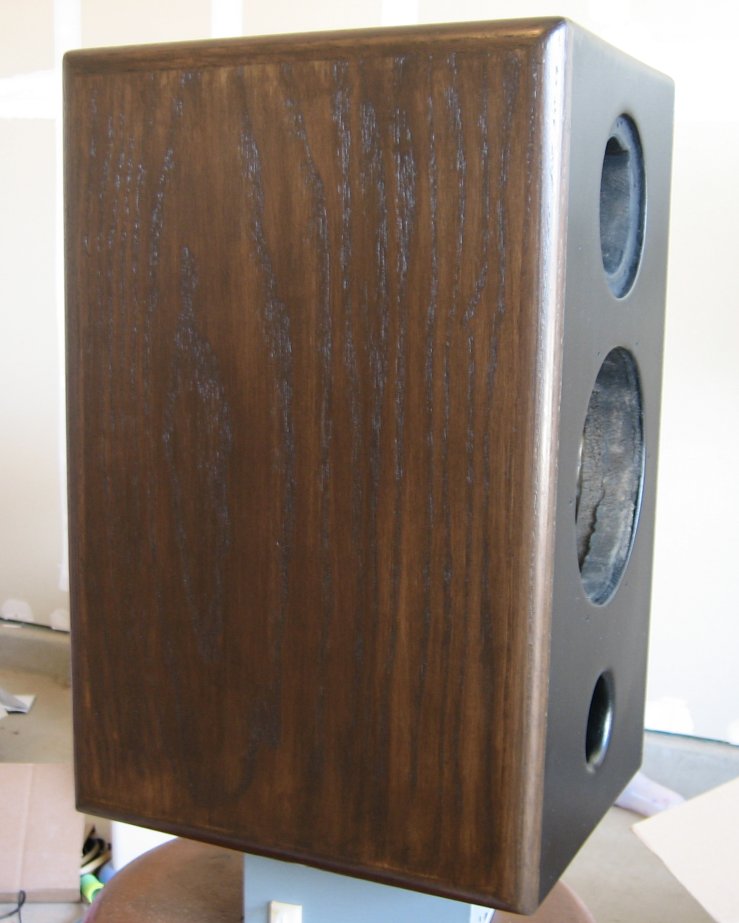
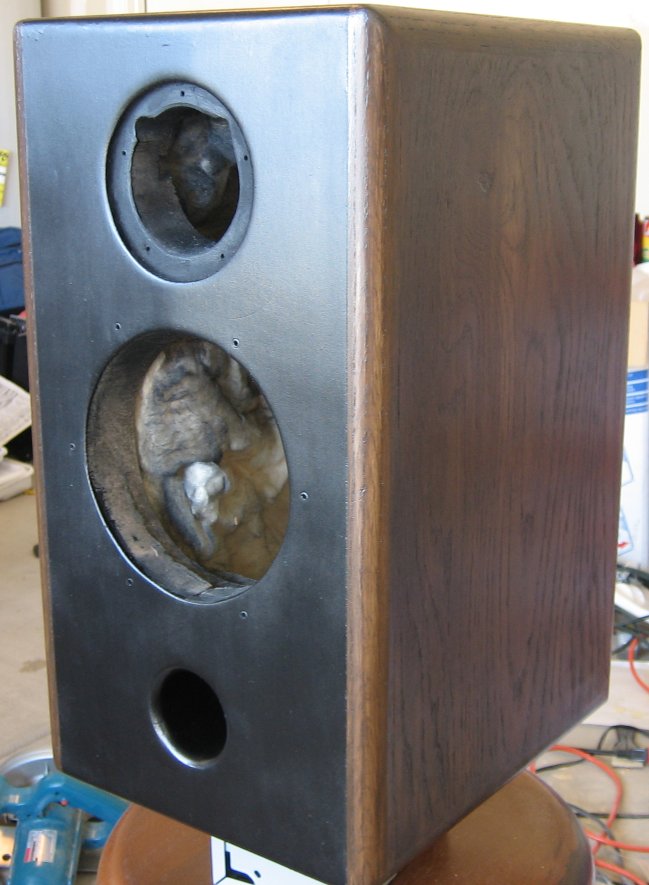
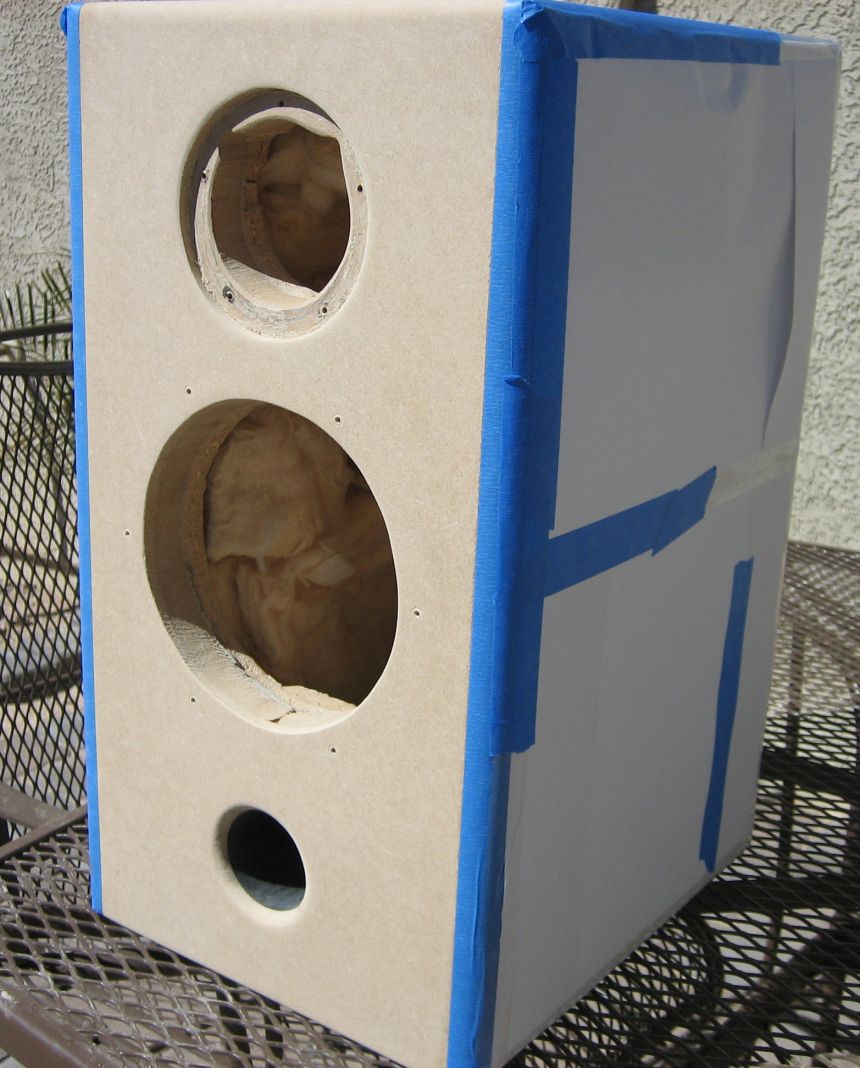
February 19th 2006 - Masking the Oak Sides of My
Speakers for Primer I masked
the oak sides of my W625X speakers in
preparation for the first coat of primer and lacquer. I used that
blue 3M tape you use for masking the edges of your walls in the house for
painting since it sticks really well and doesn't allow any bleeding, as
long as the surface is smooth. I finished sanding down the boxes
yesterday so they are nice and smooth and ready for the finish. In
the past I have stained the box first by masking off the black lacquer
part first, and then after staining masking the stained part to do the
black part, as with my center channel speaker,
but I decided to do it the other way around this time and see if I can't
get the stained part to turn out a little better by doing that last.
A few sheets of computer paper cover the sides of the box and prevent any
overspray from the primer from getting on the oak sides. |
| |
|
|
|
 |
 |
 |
 |
| 3M Tape & Paper |
Masked Sides |
Gray Primer |
Ready for Lacquer |
|
|
|
June 2nd 2005 - This Web Site Gets
Redone!
Audio Innovation gets a makeover!
I've finally updated the look and feel of this web site after almost 5 years of
it looking pretty much the same. I guess you could say that along with
speaker building, designing web sites is another hobby of mine. There's
less sweat and tears involved with sitting at the computer. Especially
when it's a 115 degrees outside. So a long with the new site, I plan to
add some new content as well. Such as Dan's Album Picks of the Month.
Each month, or so, I'm going to pick a new CD that's I've bought recently and do
short review on it. Most of my opinions will be completely biased, since I
usually only pick up CD's of bands that I actually like. But for what it's
worth, I've always been a little opinionate when it comes to music, so what
better way to express some of my views than to do a small review section on this
site. Also, I'm working on several new speaker projects (check out the
links to the left) which include a pair of 2-way studio monitor-type speakers, a
pair of computer speakers for my Baby Theater, as well an extreme makeover of a
pair of cheesy 2-way bookshelf speakers with the goal to make something great
for use in the master bedroom. And later on down the road, we've got a
sweet new 10" or 12" subwoofer for my home theater to design, build, and
install. So that's the update from me. Hopefully I'll be able to
dedicate a lot more time to my passion for audio, DIY, and loudspeakers over the
next few years. So if you'd like, take a seat and click around Audio
Innovation at your leisure. And thanks again for stopping by!
|
|
|
|
|
Sept 27th 2003
Where do the years keep going? This site is now 3-1/2
years old and not much has changed since I last updated it nearly two years ago.
Anyone care to venture a guess as to the most popular page within this site?
Subwoofer Theories continues to get the most hits
and is linked to by the most web sites. I never thought it would contain
such popular information. I've decided to jump back into speaker building
again this year, and finish building my Monitor 690's. Only now they're
going to be called the W625X's - W6 woofers and DX25 tweeters in a compact
bookshelf-style speaker. I've been wanting to finish up these speakers for
a very long time, and just haven't had any time to do it. My wife and I
have a daughter now who is 8 months old and the joy of our lives. I think
it's about time to build those grills for my Swans speakers, before the dust
caps get all poked in! I'm planning on hitting CES this year for sure and
hope to get to check out all the latest and greatest innovations in audio since
the last time I went. Maybe I'll see you there?
|
|
|
July 16th 2002
I can't believe another year has
slipped past. The news is this - www.audioinnovation.com
has now become www.danmarx.org/audioinnovation. The
old domain name will no longer work and this site will experience bugs and broken
links for a while till I get everything moved over. I haven't had time
to mess around a whole lot with speakers and audio, but I have had time to
mess around with a few other things. Drop by www.danmarx.org
and see some of the other fun stuff I've been working on. That's the
news, have a great one.
|
|
|
July 11th 2001 - The Swans M3 Tower Speaker Project Begins
I've officially started on my Swans
M3 tower speakers. Click here for all the
details. I also finally got set up at home with a nice fast internet
connection. So some of the pictures on my site are going to be a bit
larger than they used to be. I promise to at least keep them under
100K. But I've been using a friend's digital camera lately and I want to
suck as much resolution as possible out of each picture. Hope you enjoy!
Also check out my forth coming speaker, the
Monitor W690. Click here for details.
|
|
|
|
|
June 30th 2001
Check out my brand new pair of surround
sound speakers. I don't have all the production notes on their
design up just yet, but I do have lots of cool pictures showing their
creation. Click
here!
|
|
|
March 13th 2001
So much has happened the last few
months I don't even know where to begin. I started out the new year
heading to Las Vegas for CES. It was such a blast. We spent an
entire day at Alexis Park auditioning just about every speaker creation known
to man. After all was said and done, my ears were beat. I'd
have to say that the one pair of speakers left a real impression on my
senses were the MBL 101 D Radialstrahlers. These speakers were
nothing less than breathtaking. I was simply blown away by everything
about the way they sounded. Most incredible speaker at the whole
show. Well there were many others too, most I can't even remember
the manufacture's name. But it was certainly a great time. I'll
definitely be at the next one next year.
I just completed another 15" TC Sounds
subwoofer for a friend. This one we covered in a birch veneer, and one
day I suppose we'll get around to staining it. That is, if he can live
to be without his sub for a week straight. This sub sounds just as
amazing as the first. In room response is incredible. It hits
deep, it's powerful, it physically moves you and most of all, it just plain
sounds great.
I've got a small project in the works to build
one of Swans older kits the M3. Parts Express supplied me with the
drivers and Jon Wan of Ohio hooked me up with the crossovers. Hats off
to both of them, especially to Parts
Express for sending me a totally free replacement driver via FedEx.
They definitely know how to keep a customer happy. This project
information can be found by clicking here or
checking out the Future Projects link under the Projects
section.
Now to all of you who have e-mailed me with
questions regarding Shiva's and TC-Sound's drivers, I am very sorry I have not
been able to respond to everybody. Please don't be offended. Just
realize that I am a very busy person and don't always have time to write
e-mails to answer all of your questions. Believe it or not, I get
numerous e-mails a day from people asking me very simple questions that I
believe if they just did a little bit more research, could find the answers to
on their own. I hope I'm not sounding too mean, because I know how much
I hate it when I never get a response from someone and I sit around wondering
whatever happened. Don't worry, I read your e-mail. I read them
all. And respond to the ones I feel my input will be most
valuable. I thank you for stopping by and supporting the site and hope
that the content herein is useful to you.
On a lighter note, I began doing home theater design, audio
engineering, whole house audio/video distribution, and a great deal of
installation and project management for a local home theater company. It has been a blast and has
occupied most of my time. I've also gotten quite a bit into the video
side of audio and home theater (since their is a HUGE video world out there
right next to audio). We just caught glimpse of the new Dwin
Transvision DLP Projectors and wow are those things amazing! This
projector can do almost anything and the picture quality is absolutely
stunning. And it should be, it retails at just around $12,800 yet can
blow out of the water many projectors costing twice as much. Bottom line
- I want one. I want one bad. So aside from all that, life moves
forward.
|
|
|
September 20th 2000
I wasn't sure where else to throw
up this picture where it could be seen, but check out Denis
Dube's Shiva/PR Subwoofer setup. I am also currently working on
various projects that are still under wraps and cannot be discussed as of
yet. But you will soon be seeing a few subs along the lines
of professional end tables as well as a couple of subs using the infamous Aura
1808 (Seismic) driver.
|
|
|
July 18th 2000
Added a page giving the meter
correction values for the analog SPL meter from Radio Shack. Includes a
printable text file for easy reference. Also includes a link to a post
made on the Home Theater Forum describing the procedure for
measuring a loudspeaker properly. Check it
out here.
|
|
|
July 8th 2000
TC-Sounds
15" Subwoofer. Check out the plans and pictures of my latest work
of art. This subwoofer is going to absolutely pound. Buckle your
seat belt before proceeding to this link...
|
|
|
June 29th 2000
The hottest news going around
the DIY circuit these days is the release of a variety of brand new 10",
12", and 15" Extremely High Excursion subwoofers. We're talking about
subwoofers with excursion capabilities up to 3.0 inches. Magnets
as heavy as your average 14 pound bowling ball. Surrounds that extend
nearly the entire surface of the cone. Power handling capabilities
into the megawatts. Specially designed spiders and motor structures
that can withstand 300 pounds of force. Yet the fun doesn't stop
with just the subs. There is a new line of 10", 12" and 15" Passive
Radiators up for sale with 3.75 inches of peak-to-peak excursion and are
capable of of supporting over 3,000 grams of added mass. The inventor
and co-designer of these outrageous speakers is none other than Deon Bearden
himself. Yes, the man behind The Beast. Check out The
Basszone for more information. You can also go to The
Home Theater Forum and read what's already being said about these drivers
including a post from Deon explaining how these drivers came to be.
Thanks Deon for all your hard work!
|
|
|
June 15th 2000
This web page is undergoing
a major change. Some of the links may be down or a few of the pages
not totally complete. Some of the older stuff will be deleted completely
to make room for all the new stuff. Let
me know what you think of the new site.
|
|
|
April 24th 2000
For those of you who have
been waiting patiently for the arrival of my 10" sub with 3 10" Passive
Radiators, you need not wait any longer. The tiny subs of all tiny
subs has arrived and it's punching out bass like no other. But be
for warned, this sub is having a major identity crisis - it thinks it's
a 15" woofer in a 5 cubic foot box. Click
here to find out more.
|
|
|
March 15th 2000
I finally got
back the pictures of my 15" Ultimate Attitude Subwoofer.
Follow the link to find out more.
|
|
|
Sometime in 1999
This web page is created
and hosted under the name of my high school DJ gig called Audio Innovation. |
|
|
 |
|
|
|
Disclaimer:
This site is intended for personal and/or private use only. All ideas,
quotes and formulas give full credit to original authors. All
other information is strictly my own. I do not claim
responsibility for personal, physical, mental psychological, and/or
financial harm done to anyone in any
way, shape, or form as a result of the publication of this site.
This site is
hosted by Total Choice Hosting and
maintained by Daniel Marx.

|
|


.jpg)
.jpg)
.jpg)
.jpg)
.jpg)
.jpg)


